6 charts from new report show how much California’s climate has already changed
Warmer days — and nights. Rising sea levels. Less water available in summer.
A report released Wednesday by state officials says climate change is affecting California’s ecosystem already in ways great and small.
The document looks at 36 indicators that measure aspects of climate change, including human-influenced causes of climate change such as greenhouse gas emissions and the impact of the changes on people and wildlife.
The report is the third assessment of climate change's effects in the past nine years by the California Environmental Protection Agency and the Office of Environmental Health Hazard Assessment.
The latest effort shows “some of the trends are continuing, some of the trends are accelerating,” said spokesman Sam Delson of the health hazard office. Here are a few examples:
Annual average air temps rising
Since 1895, annual average air temps have increased throughout the state, rising at a faster rate beginning in the 1980s.

Average nightly low temperatures rising
Average decadal nightly lows and average decadal highs are rising relative to the long-term average temperature based on data from 1949 to 2005. Night temps have increased at a rate of 2.3°F per century, compared to 1.3°F per century for day high temps.

Sacramento River spring runoff
Snowmelt runoff into the Sacramento River between April and July relative to total year-round water runoff has declined over the past century.

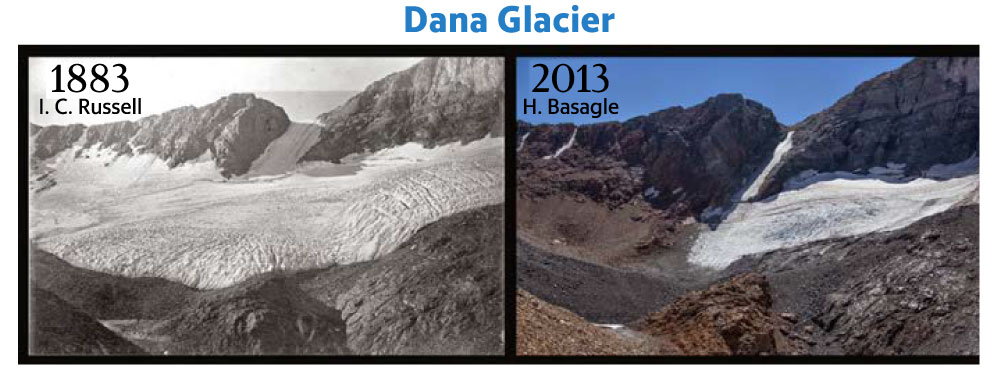
Shrinking glaciers in the Sierra
From the beginning of the 20th century to 2014, some of the largest glaciers in the Sierra have lost an average of about 70 percent of their area.
Sea level creeping up
Along the California coast, mean sea levels have generally risen. Since 1900, mean sea level has increased by about 180 millimeters (7 inches) at San Francisco.

Wildfires
The area burned by wildfires each year has been increasing since 1950. Five of the largest fire years have occurred since 2006.

This story was originally published May 9, 2018 at 12:01 AM with the headline "6 charts from new report show how much California’s climate has already changed."